Here we look at the moving average convergence divergence (MACD) histogram, a measurement of the difference between the fast MACD line and the signal line. (Learn more in A Primer On The MACD.)
The calculation of the signal line requires that you take the difference between the two EMAs, and from that number create a nine-day moving average. But sophisticated charting software makeslife easy with its back-testing capabilities that automatically prepareall the calculations instantly for the user. In this respect, it issometimes interesting to know the formula used to derive the number,but never necessary to start calculating the numbers on your own.
Principles
Herewe look at a number of charts and explain them in detail so that youfully understand this important indicator, and its clear buy and sellsignals. First let's highlight the principles of all technical work:
- Stock prices tend to move in trends.
- Volume is always a strong component with the trends.
- Trends will tend to continue with strength, once established.
Nortel Example
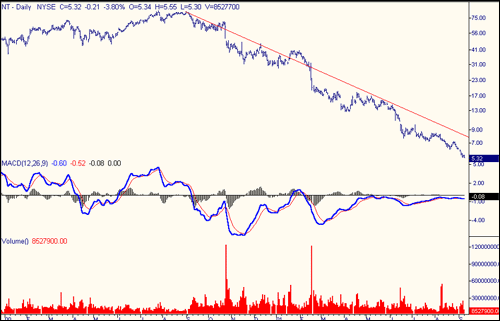
The first chart is that of NortelNetworks, the Canadian tech giant that saw its stock price drop fromthe C$120 area to under $9 in a period of 53 weeks. Apart from two verystrong sell signals in the summer of 2000, investorspaid little attention to these strong overbought points and continuedto trade into the "street" hype that was the norm surrounding so manyof the tech/internet issues of that period.
Since the earlypart of Sept 2000, the downtrend that was then established remainedintact. Now, having said that, there were buyers from those loftylevels all the way down to its single-digit trading price: why would abroker or financial advisor put a client back into an issue that displays nothing but heavy selling to the downside?
Youcan see by the trendline drawn on the chart, there was no change in thetrend since Aug 2000, and look closely at the diminished volume overthe last four months or so shown on the chart. At the same time the moving averages of the MACD were hugging the signal line, showing no clear buy or sell signal at all.
 | | Figure 1: Nortel Example Chart | | Created Using TradeStation 2000 |
At that time, comments made by company CEO John Roth had indicatedthat the company would find itself in a rebuilding mode until late 2002and perhaps even into the early part of 2003. Now from a fundamentalstandpoint, the technician would have stayed away from this chartbecause a sideways trading pattern would start to develop once a bottomwas established, and in the case of Nortel Networks, the bottom wasimminent. (Learn more about using MACD in Spotting Trend Reversals With MACD.)
Cisco Example
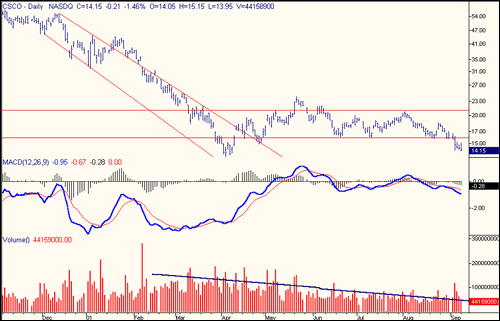
Inthe second chart, that of Cisco Systems, two very clear sell signalswere indicated. The first, in Dec 2000 from the $55 level saw the stockprice drop off dramatically to about the $35 level in a matter of a fewtrading days and then another sell signal triggered another series ofdown days seeing the issue drop to the mid-teens in a period of twomonths. Since then, you could see that the company traded in a somewhatnarrow range (sideways movement) and the two EMAs that made up the MACDwere hugging the signal line. This is a "wait-and-see" pattern. Take agood look at the trendline, showing the downtrend in volume during thisperiod of sideways trading. No interest, no volume.
 | | Created by TradeStation 2000 |
Conclusion
MACD helps you to determine changesin trends, either short-term or the long-term variety. Learn torecognize them and do not bet against them. (For more, check out Moving Average MACD Combo and Trading The MACD Divergence.)
by Investopedia Staff, |